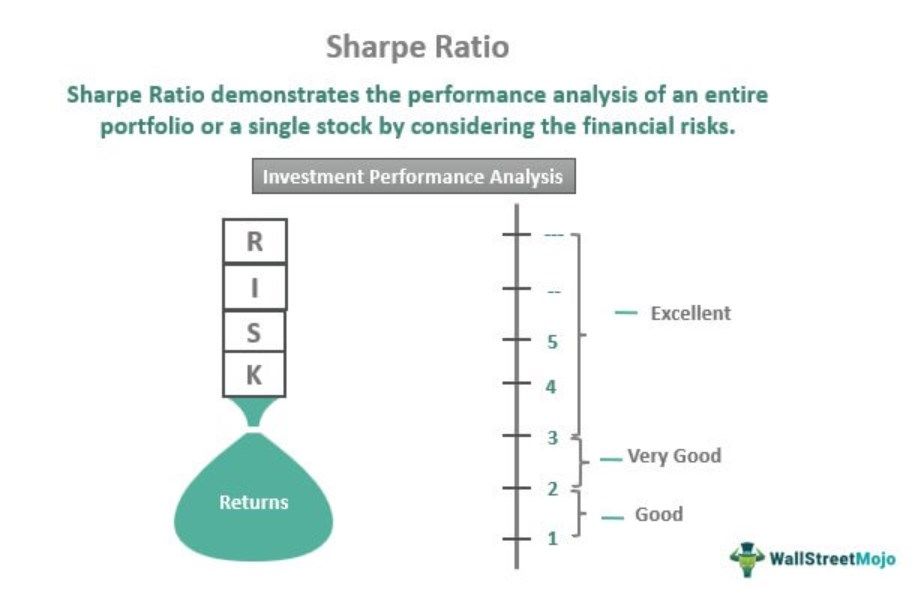
What Is Sharpe Ratio?
Sharpe ratio is the financial metric to calculate the portfolio’s risk-adjusted return. It has a formula that helps calculate the performance of a financial portfolio. To clarify, a portfolio with higher ratio is considered good and preferable to its rivals.
William F Sharpe, the Nobel Laureate and emeritus professor of finance at Stanford University, instituted the ratio. Moreover, it measures investment performance by adjusting for the risk. Furthermore, the Sharpe index of the risk-free asset is zero. It may be used to analyze an overall portfolio, a single investment, or a stock.
- The Sharpe ratio denotes an analytical tool to assess risk-adjusted returns on the financial portfolio or single security. Furthermore, it displays the investor’s additional return earned after taking the additional risk.
- An investment portfolio with a greater Sharpe index is considered good and more desirable than the others.
- To calculate the Sharpe index, {Portfolio return – Risk-free rate-of-return}/Standard deviation
- It differs from the information ratio as the former assesses the fund’s risk to produce returns higher than the risk-free rate. While the latter evaluates the fund’s performance against its benchmark.
Sharpe Ratio Explained
Sharpe ratio definition suggests measuring the risk-adjusted return of the investment portfolio. Thus, it does not independently offer detailed information regarding the fund’s performance. However, the diversified portfolio with funds having little to no relationship decreases the absolute risk, thereby surging the Sharpe index.
To clarify, the calculation of Sharpe ratio assesses standard deviation, which presumes a uniform dispersal of returns. Hence, it might not be a good performance metric for variable return distribution with skewness lesser or greater than zero. Moreover, as standard deviation contemplates positive and negative variability from the mean return, its measurement of the downside risk is inaccurate.
Please note that a Higher Sharpe index ensures a greater investment return corresponding to the risk, confirming a better investment. In addition of evaluating the risk-free rate, it revolves around returns maximization and volatility reduction.
To clarify, it is used with Jason’s Alphas and the Treynor Ratio to rank the performance of several fund managers or portfolios. However, please note that the returns of various financial assets can fluctuate from a normal distribution, resulting in misleading Sharpe index interpretations.
Please note that the fund manager may improve the situation and avoid writing out-of-the-money sell and buy decisions of the portfolio. Moreover, this includes averting situations with default risk and irregular marking to market of less liquid assets.
PE Ratio in Stocks Explained in Video
Sharpe Ratio Formula
So, the Sharpe ratio formula is,
{R (p) – R (f)}/s (p)
Please note that here,
- R (p) = Portfolio return
- R (f) = Risk-free rate-of-return
- s (p) = Standard deviation of the portfolio
In other words, amid multiple funds with similar returns, the one with a greater standard deviation possesses a lesser Sharpe index. So, it must produce a higher return to balance the greater deviation and sustain the higher ratio. Also, adding new underlying assets can stimulate the total portfolio return with no extreme risk.
Though practically impossible, the investment with a 10% annual return and zero volatility has an infinite Sharpe index. So, the predicted return must substantially increase with surged volatility to nullify the additional risk.
Examples
To clarify, here are some examples to understand the Sharpe ratio formula and calculation.
Example #1
Say that Brian makes a $45,000 portfolio investment with an anticipated 12% return and 10% volatility. In addition, the efficient portfolio has an expected return of 17% and 12% volatility with a 5% risk-free interest rate. Now, he will apply the following formula for the calculation of Sharpe ratio,
{R (p) – R (f)}/s (p)
Here,
R (p) = 0.12
R (f) = 0.05
s (p) = 0.10
So,
= {0.12 – 0.05}/0.10
= {0.07}/0.10
Hence, Sharpe index = 70% or 0.7
Example #2
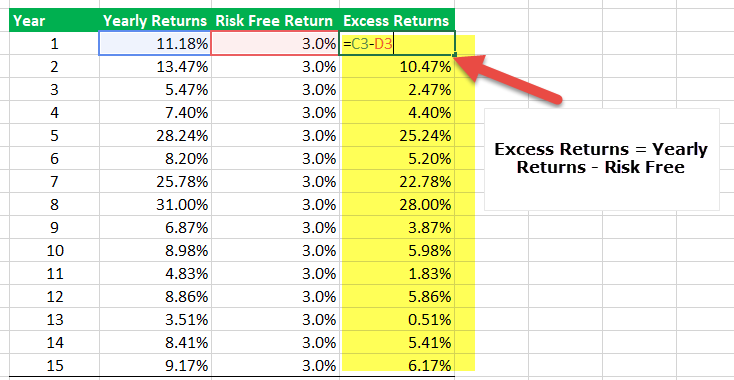
Below is the excel sheet of a mutual fund’s annual returns.
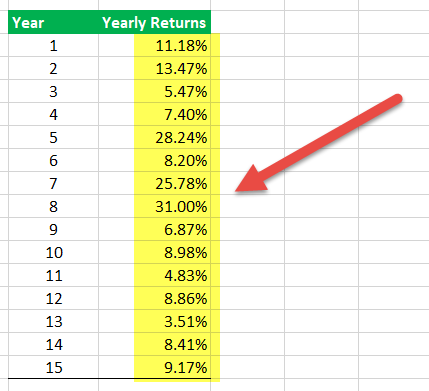
Here is the step-by-step procedure to calculate the ratio in the excel sheet.
- Say the risk-free return over 15 years is 3.0%. As it may change annually, it is essential to put the current percentage on the table.
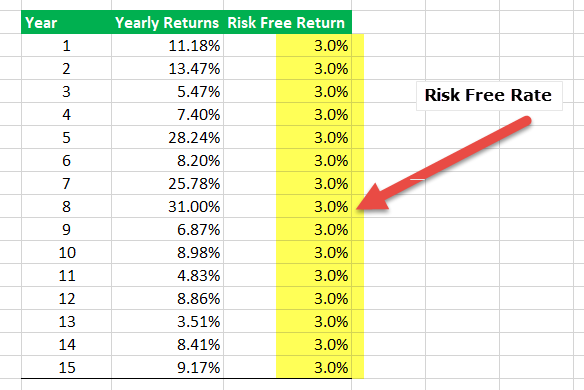
- Then, the excess returns are computed by subtracting the risk-free return from annual returns.
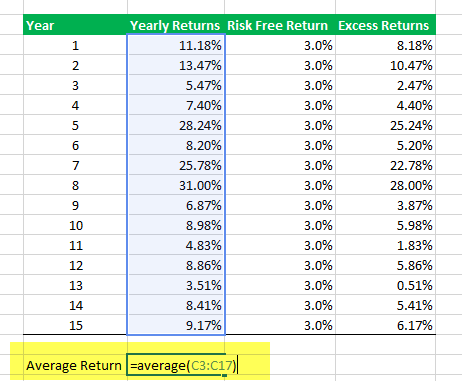
- Afterward, the excel formula AVERAGE is used to calculate the average of the financial portfolio. As shown below, the average return, in this case, is 12.09%.
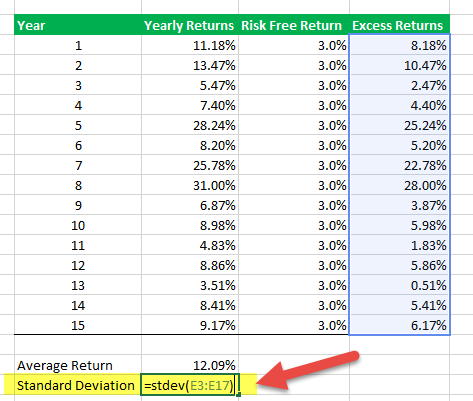
- The excel formula STDEV calculates the standard deviation of other returns. Here, the standard deviation is equivalent to 8.8%.
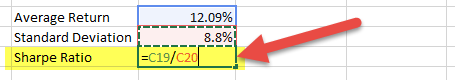
- Lastly, the Sharpe index is computed by dividing the average returns by standard deviation.12.09/8.8 = 1.37
Example #3
Two asset managers, Brad Roth, and CK Zheng share their strategies to handle 2022’s crypto fluctuations. While Roth is the chief investment officer at Thor Financial Technologies, Zheng is the co-founder of ZX Squared Capital, a digital asset hedge fund.
Meanwhile, Roth leverages risk-managed spot Ethereum and risk-managed spot Bitcoin to move them to a safe or risk-off mode. Therefore, he can successfully eschew trading as crypto rates go down. Though ZX Squared Capital also invests in Ethereum and bitcoin, it handles risk through futures and options to attain the higher Sharpe index. Subsequently, this indicates a better risk-adjusted return. Over the last 12 months, the plan of ZX Squared has undergone around 30%-35% volatility, just like the Nasdaq 100 stock. Meanwhile, it targets a Sharpe index of 2.0, twice bitcoin’s sharpe index of 1.0.
Sharpe Ratio Vs Information Ratio
| Particulars | Sharpe Ratio | Information Ratio |
|---|---|---|
| Definition | Measures an investment’s risk-adjusted returns over the risk-free rate of return. | Measures an investment’s risk-adjusted returns over the benchmark for a particular period. |
| Utility | Risk assessment of the fund produces returns greater than the risk-free rate. | Performance assessment of the fund against its benchmark. |
| Beneficial to investors | Relatively less | Relatively more |
| Representation of returns | Excess returns | Active returns |
| Benefits | Fund comparison Portfolio diversification analysis Fund’s performance review Risk factor calculation | Evaluation of Fund Manager’s performance Determining the tracking error Comparison of fund’s returns Understanding the fund’s consistency level |
| Drawbacks | Elimination of extreme returns Elicited from the normal distribution No difference between volatilities Distorted values of funds with negative return | Probable interpretation difference from others Inappropriate for multiple funds Ignores the effect of leverage on portfolio returns An improper metric for investment decisions |
Frequently Asked Questions (FAQs)
What Is a Good Sharpe Ratio?
Investments with a good Sharpe ratio range between 1 and 2.
Furthermore, the ratio between 2 and 3 is regarded as very good while the one above three is deemed as excellent. Please note that a good Sharpe ratio ensures higher returns while poor (less than 1) ones display lesser returns.
How To Calculate the Sharpe Ratio?
The risk-free rate is subtracted from the portfolio return to calculate the Sharpe ratio. The result is then divided by the standard deviation of the portfolio’s additional return.
Moreover, the risk-free rate could be the US treasury yield or rate.
What Is Sharpe Ratio in Mutual Fund?
Sharpe ratio in mutual funds denotes the method for an investment’s performance measurement after considering the risks. It demonstrates the excess return the investor gains after taking excess risk. William F Sharpe, the Nobel laureate and emeritus Professor of finance at Stanford University, designed the concept.
Recommended Articles
This has been a guide to Sharpe Ratio and its definition. Here we explain a good Sharpe ratio, its formula for calculation, and examples. You may learn more about financing from the following articles –